Graphs A and B shown below depict interaction of two species, Which graph indicates Mutualism ?
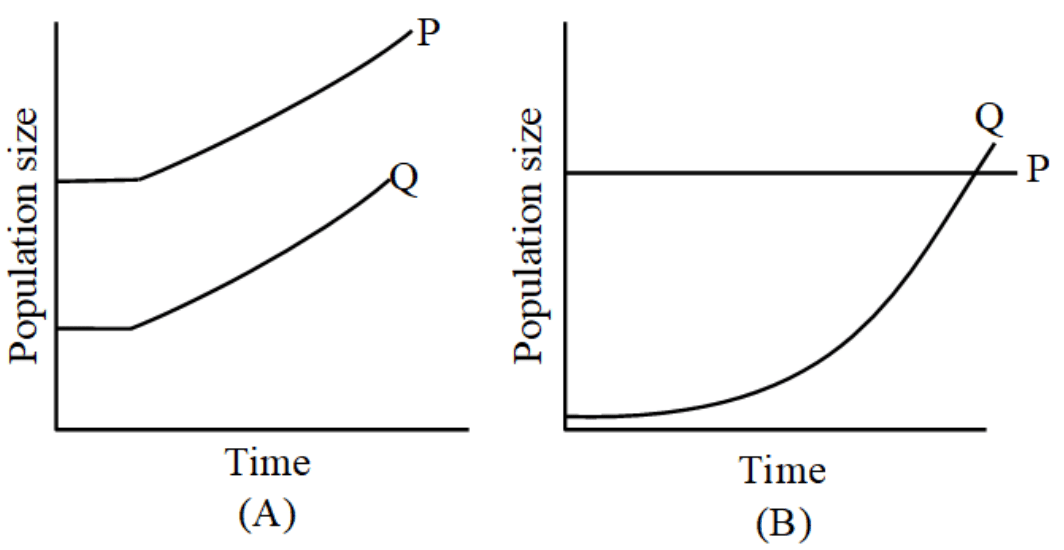
Which of the interactions has negative effects ? (i) Predation (ii) Mutualism (i
NextMatch the following and Choose the correct answer
The predator maintain species diversity this can be explain by following experimental example :-
MediumMatch the following Column-I with Column-II
MediumThe two basic processes, contribute to an increase in population density in a given habitat during a
MediumWhich of the following statements is incorrect regarding the Logistic Growth Model?
MediumWhich of the following attributes is found in a 'Population' but NOT in an 'Individual'?
MediumComplete the following table of Interspecific Interactions:
Practice Botany Exams
Full-length mock tests with detailed analytics, rank, and percentile.
Browse Exams